Modeling Loans’ Probability of Default Using Machine Learning
How to treat credit risk with advanced machine learning techniques

VALOORES digitalization trends continue to shape the world opening up new opportunities across a wide range of sectors. Artificial intelligence is considered a key driver of digital transformation that has the potential to introduce new sources of growth. The recent advances in machine learning and automation have created a whole new business ecosystem.
Introduction and Business Need
The analysis of the Probability of Default is one of the main tasks to be undertaken by financial institutions, where it is important to gauge the likelihood of a borrower defaulting before giving a certain loan. The lack of a correct methodology to calculate this probability may lead to high losses, create systemic risk and affect the whole economy of the financial institution. An accurate prediction of default risk in lending has been a crucial subject for banks and other lenders, but the availability of open source data and large datasets, together with advances in computational and algorithmic data analytics techniques have renewed interest in this risk prediction task.
The purpose of this work is to build a machine learning model employed to predict the Probability of Default, based on the personal information and loan provided, as well as the high number of factors that might affect borrower default rate. The obtained results are intended to be used as a reference tool for financial institutions to help them make good decisions that reduce the risk of default and maximize the profit.
About the Dataset and Data Analysis
It is fair to say that we have all sensed the major progression of data that took place during the last decade. Data has become the fuel of the 21st century, used to satisfy business requirements.
The unsecured loans dataset, provided by LendingClub company, includes 844000 expired loans originated between 2012 and 2015, labeled either Fully Paid or Charged-Off(defaulted) and including loan’s financial data and borrower’s personal data.
a. Explanatory Variables Cleansing and Preprocessing
After the application of dimensionality reduction on the 144 dataset’s variables, the final selection of the remaining 26 features shows:
Data related to the Loan
· Interest rate
· Term: the scheduled maturity of the loan
· Purpose: debt consolidation, credit card, home improvement, SME or other
· Grade: the risk level set by LendingClub (A, B, C, D, E, F, G)
Data related to the borrower
· Employment length in years
· Public reported bankruptcies
· Home ownership: mortgage, rent or own
· Debt to Income ratio = reported debts/reported incomes
Generated Ratios
· Months since first opened credit line
· Open account ratio = number of open accounts/number of total accounts
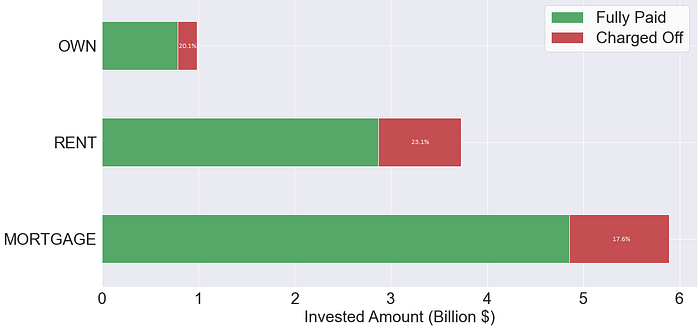
The most important part when dealing with any dataset is the cleaning and preprocessing of the data. As a first step, the null values of numerical and categorical variables were replaced respectively by the median and the mode of their available values. The second step would be dealing with categorical variables, which are not supported by our models. We associated a numerical value to each category, based on the default rate rank. For Home Ownership, the 3 categories: mortgage (17.6%), rent (23.1%) and own (20.1%), were replaced by 3, 1 and 2 respectively.
b. Descriptive Analytics
Before going into the predictive models, it’s always fun to make some statistics in order to have a global view about the data at hand.
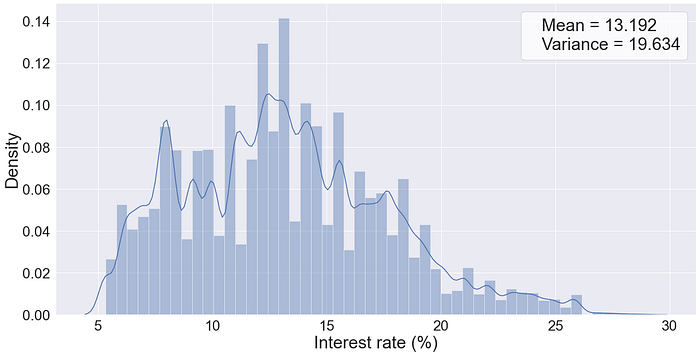
The first question that comes to mind would be regarding the default rate. For the used dataset, we find a high default rate of 20.3%, compared to an ordinary portfolio in normal circumstance (5–10%). Risky portfolios usually translate into high interest rates that are shown in Fig.1.
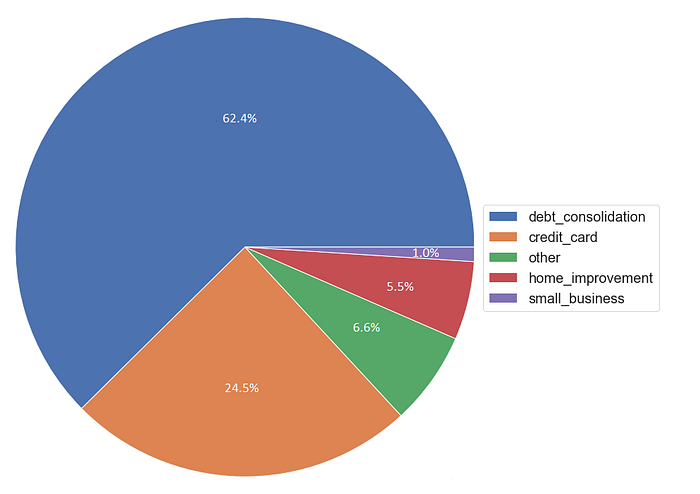
Digging deeper into the dataset (Fig.2), we found out that 62.4% of all the amount invested was borrowed for debt consolidation purposes, which magnifies a “junk loans” portfolio.
In addition, the borrowers’ home ownership is a good indicator of the ability to pay back debt without defaulting (Fig.3).
The grading system of LendingClub classifies loans by their risk level from A (low-risk) to G (high-risk). Fig.4 shows the variation of the default rates against the borrowers’ average annual incomes with respect to the company’s grade.

c. Multicollinearity Assessment
Multicollinearity is mainly caused by the inclusion of a variable which is computed from other variables in the data set. It makes it hard to estimate precisely the regression coefficient and weakens the statistical power of the applied model. Multicollinearity can be detected with the help of the variance inflation factor (VIF), quantifying how much the variance is inflated.

A kth predictor VIF of 1 indicates that there is no correlation between this variable and the remaining predictor variables. A general rule of thumb suggests a moderate correlation for VIFs between 1 and 5, while VIFs exceeding 5 are critical levels of multicollinearity where the coefficients are poorly estimated, and the p-values are questionable. Based on the VIFs of the variables, the financial knowledge and the data description, we’ve removed the sub-grade and interest rate variables.
About the Machine Learning Models
To predict the Probability of Default and reduce the credit risk, we applied two supervised machine learning models from two different generations.
As we all know, when the task consists of predicting a probability or a binary classification problem, the most common used model in the credit scoring industry is the Logistic Regression. It is a regression that transforms the output Y ∈ ℝ of a linear regression into a proportion p ∈ ]0,1[ by applying the sigmoid function.
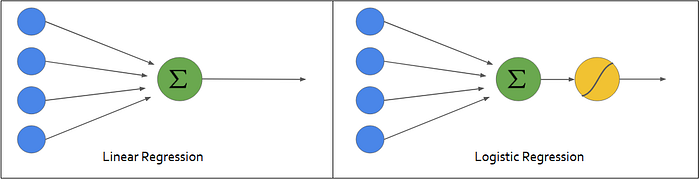
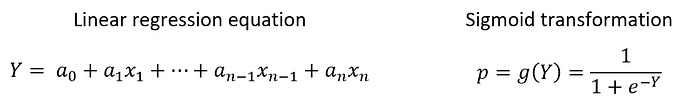
While the logistic regression can’t detect nonlinear patterns, more advanced machine learning techniques must take place.
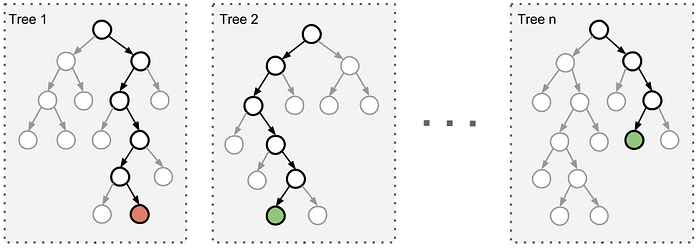
Extreme Gradient Boost, famously known as XGBoost, is for now one of the most recommended predictors for credit scoring. It is the queen of supervised machine learning that will rein in the current era. XGBoost is an ensemble method that applies boosting technique on weak learners (decision trees) in order to optimize their performance.
Model Development and Comparison
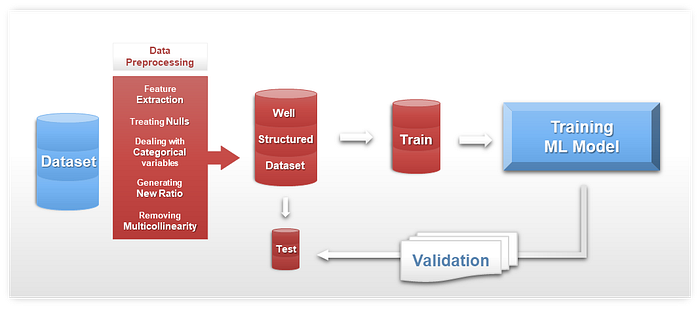
a. Workflow
The below figure represents the supervised machine learning workflow that we followed, from the original dataset to training and validating the model. Python was used to apply this workflow since it’s one of the most efficient programming languages for data science and machine learning.
b. Validation and Comparison
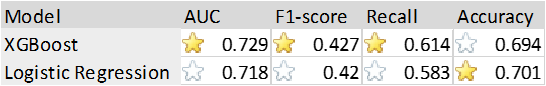
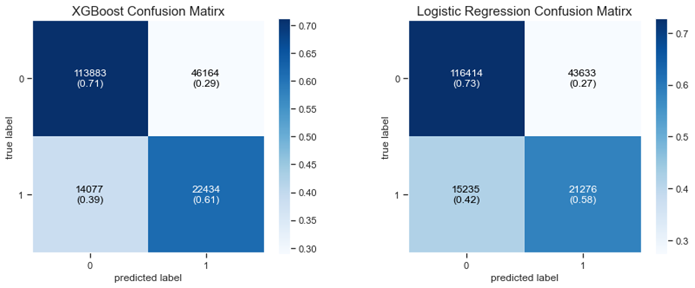
Benchmark researches recommend the use of at least three performance measures to evaluate credit scoring models, namely the ROC AUC and the metrics calculated based on the confusion matrix (i.e. accuracy, recall, f1-score …).
Relying on the results shown in Table.1 and on the confusion matrices of each model (Fig.8), both models performed well on the test dataset. The XGBoost seems to outperform the Logistic Regression in most of the chosen measures. At first glance, many would consider it as insignificant difference between the two models; this would make sense if it was an apple/orange classification problem. However, in a credit scoring problem, any increase in the performance would avoid huge loss to investors especially in an 11 billion $ portfolio, where a 0.1% decrease would generate a loss of millions of dollars.
Conclusion and Future Orientation
In this article, we’ve managed to train and compare the results of two well performing machine learning models, although modeling the probability of default was always considered to be a challenge for financial institutions. In order to further improve this work, it is important to interpret the obtained results, that will determine the main driving features for the credit default analysis. The final steps of this project are the deployment of the model and the monitor of its performance when new records are observed.
For more information about us, feel free to check our website.
Think Big, Move Fast!